From Hotspots to Burn Scars: Reading the Changes at Bromo

The fire that swept through the Bromo area left a mark readable from space. Using remote sensing data, changes to the area can be observed not only by comparing conditions before and after the event, but also by tracking the pattern of thermal activity over time. Through Piksel, Sentinel-2 imagery and hotspot data from VIIRS (Visible Infrared Imaging Radiometer Suite) are combined to build a picture of where the fire occurred, when activity was detected, and how the landscape changed.
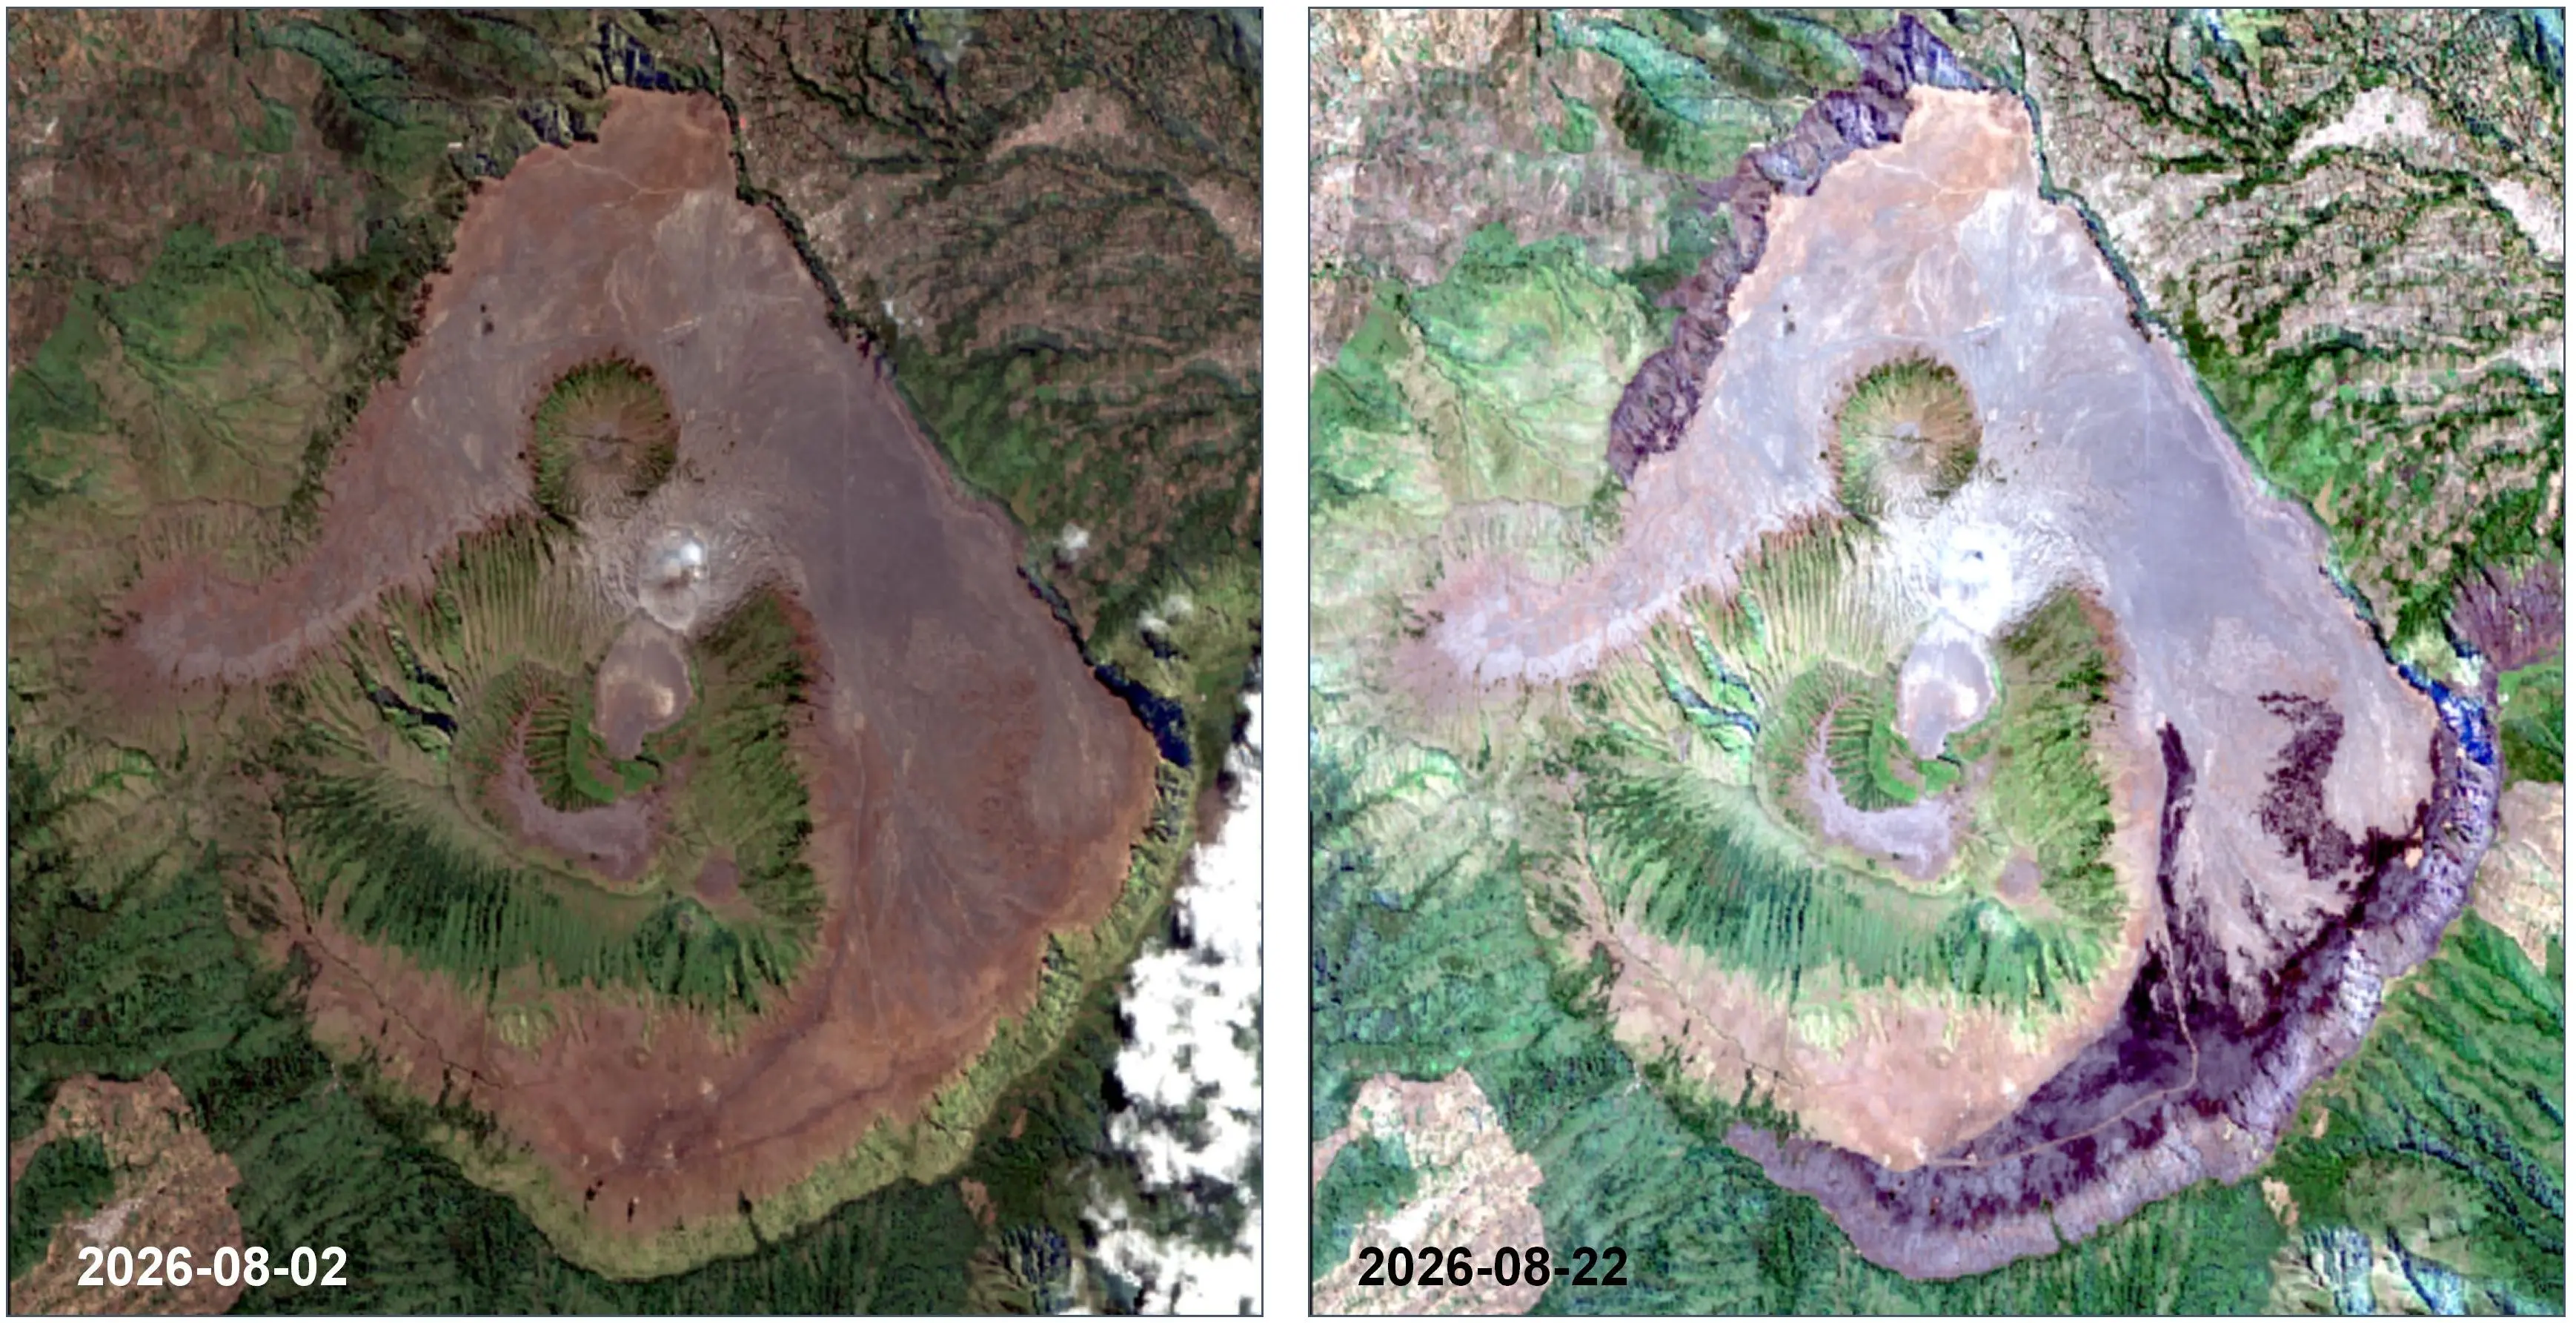
A Sentinel-2 image from 2 August 2026 shows conditions before the post-fire changes, while the 22 August 2026 image captures the area after a series of fire activity was detected. Comparing the two reveals shifts in spectral tone and character across parts of the Bromo area. Sections that previously had relatively uniform vegetation cover show clear differences in the later image — changes that can indicate burnt or damaged vegetation. With further analysis, Sentinel-2 can be used to identify and delineate areas likely affected by the fire.
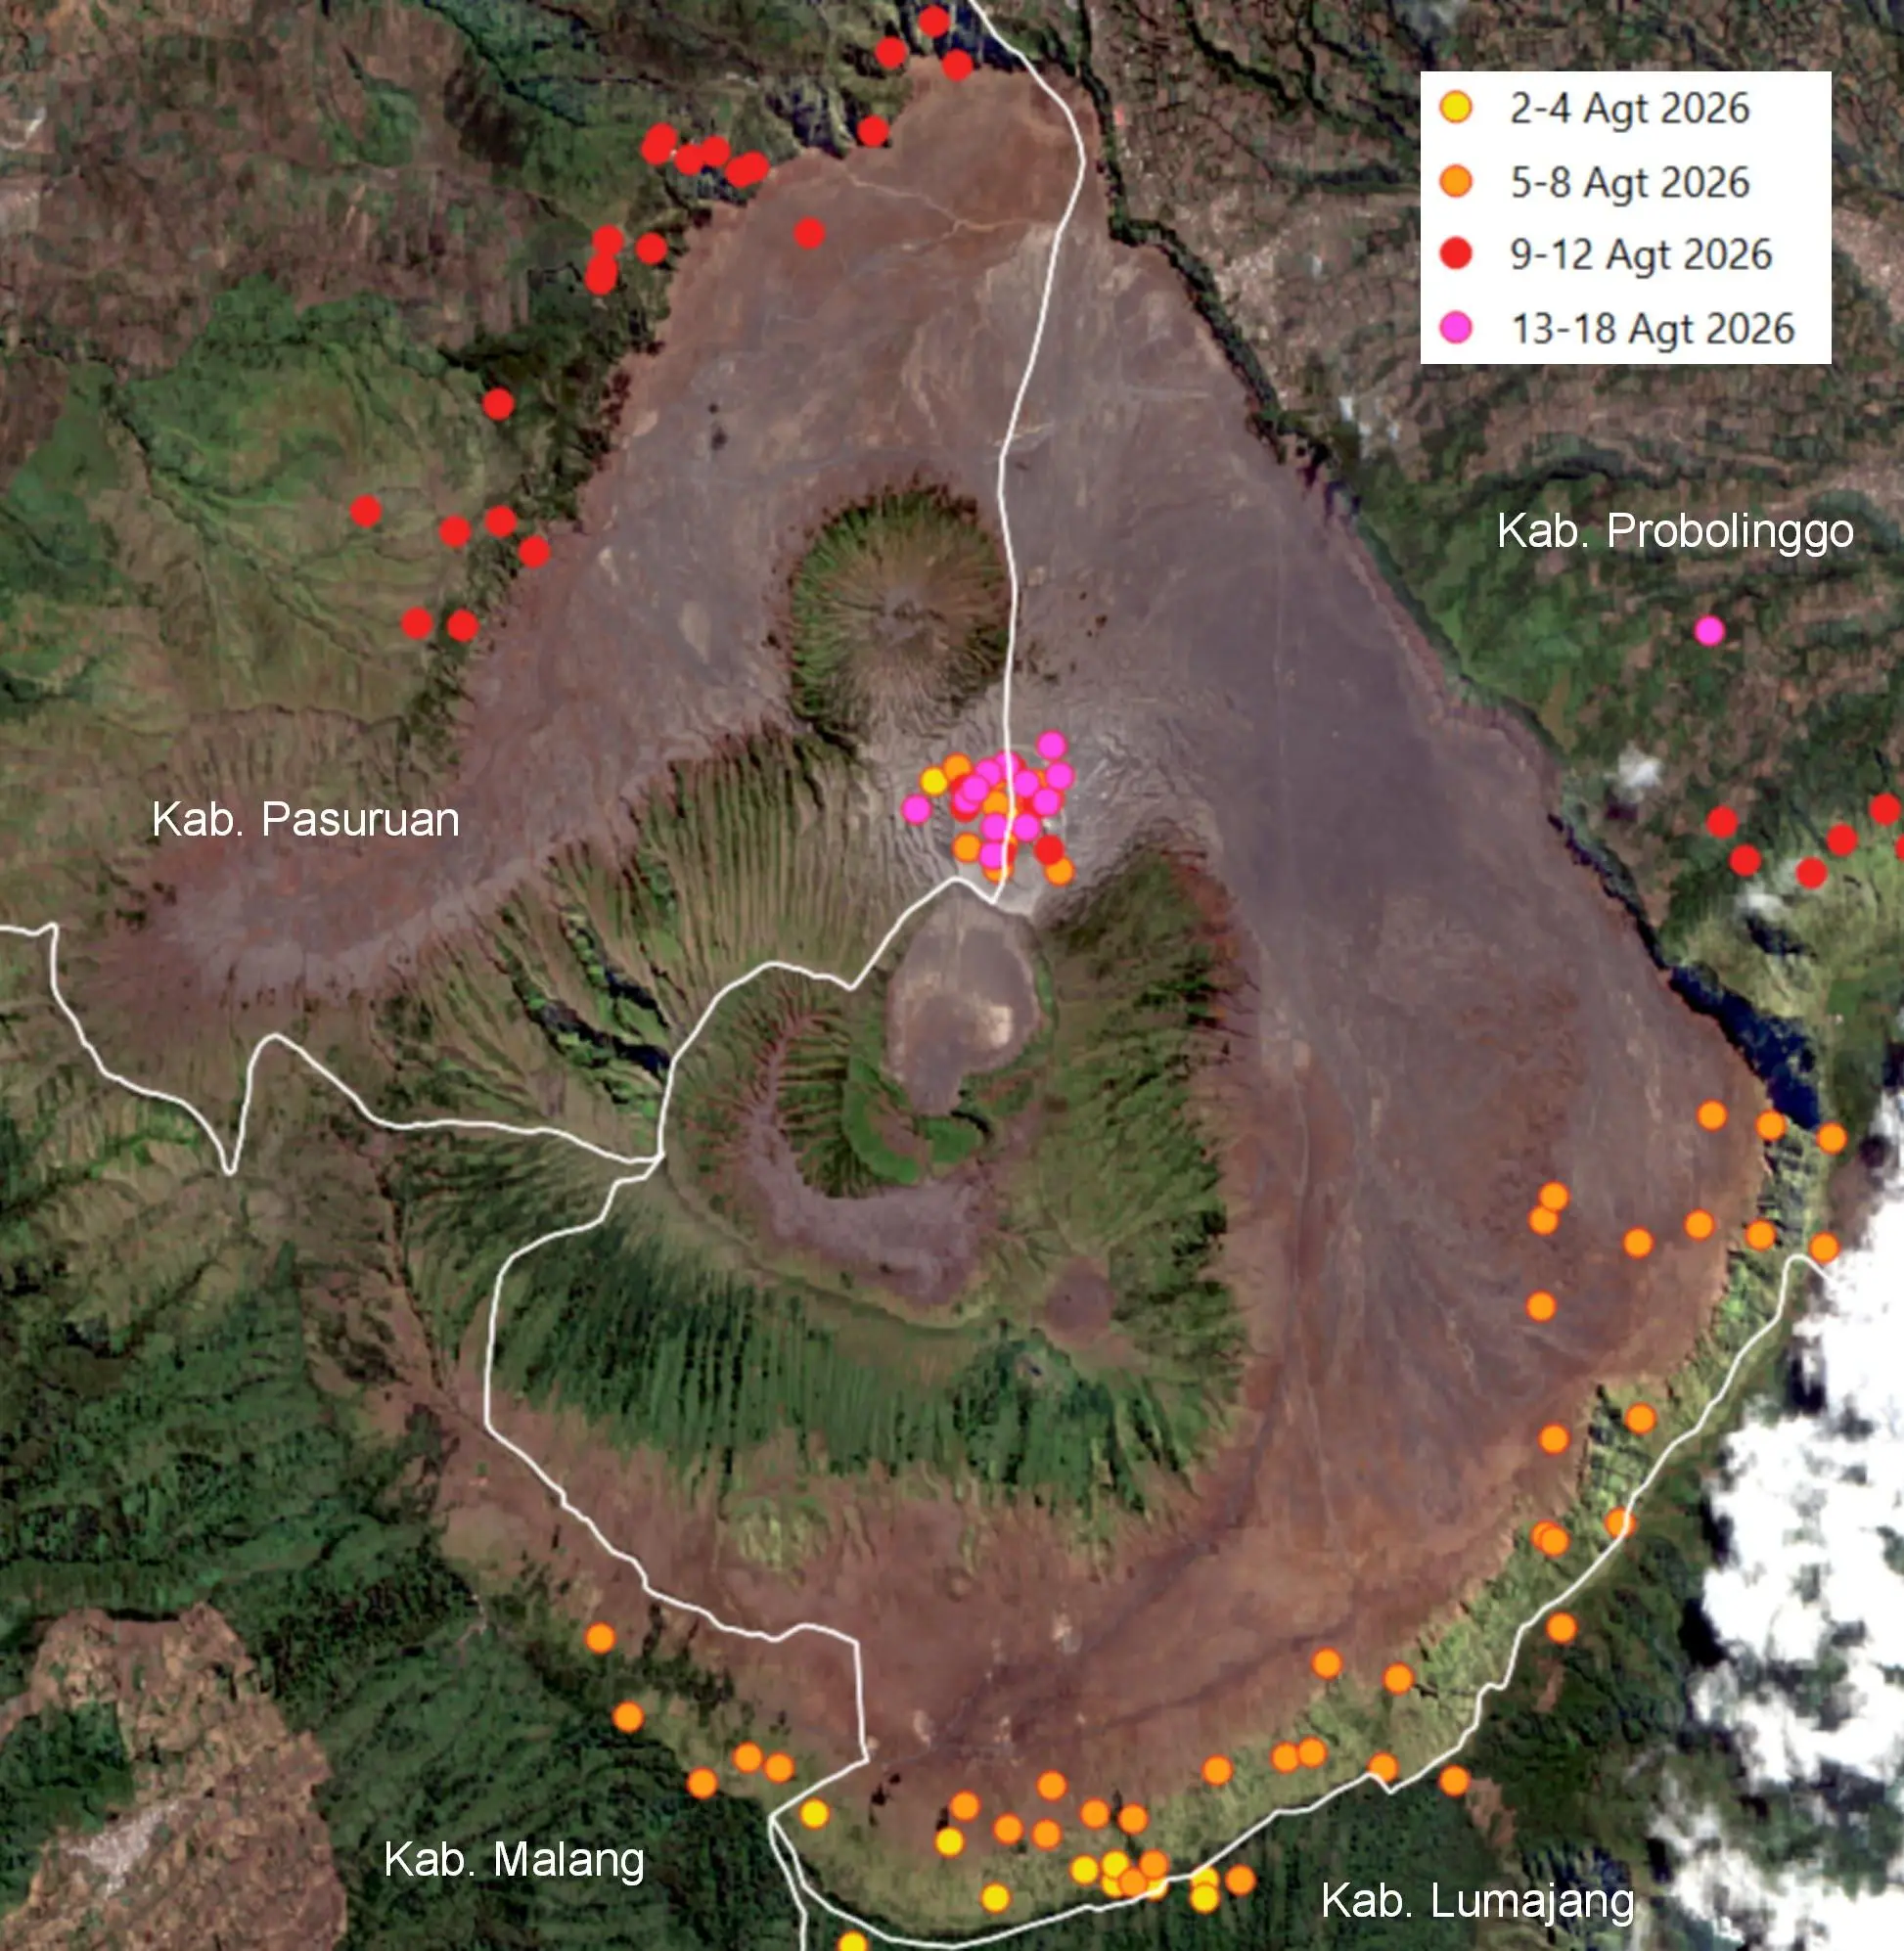
To trace how the event unfolded over time, Piksel draws on NASA's VIIRS hotspot data. Active fire detections mark locations where the satellite observed thermal anomalies meeting certain criteria at the time of the pass. When these points are arranged by date, the shifting pattern and concentration of heat activity across the Bromo area becomes apparent. Data from 2–4 August, 5–8 August, 9–12 August, and 13–18 August 2026 show hotspots appearing at different locations and gradually forming distinct clusters. These hotspots do not directly represent fire perimeters or burned area, but they are a key indicator for tracing where and when satellite-detected heat activity occurred.
The real strength of the analysis lies in combining both data sources. VIIRS provides the temporal dimension — when and where heat activity was detected — while Sentinel-2 provides the spatial dimension — what the surface looked like before and after the event. Within Piksel, hotspot points can be analyzed by proximity in both location and time to identify discrete fire events, then linked to the surface changes visible in Sentinel-2 imagery. This moves the analysis beyond simply asking "where did the fire occur?" toward a fuller set of questions: when did heat activity first appear, how did its location pattern evolve, and what changes are visible in the aftermath?
From this combination of data, Piksel turns satellite observations into spatio-temporal information that is easier to interpret. Thermal activity can be traced by time and location, while surface changes can be examined through satellite imagery. The approach demonstrates how remote sensing technology can support a more complete understanding of an event — from detecting fire activity and tracking its development, to identifying areas that changed after the fact. For conservation area management and environmental monitoring, this kind of information can underpin surveillance, impact assessment, burn area mapping, and data-driven decision-making.